


4-Minute Read
Data-driven decisions are crucial for success, especially in today’s fast-paced business landscape. Monday.com, a powerful project management system, offers a robust dashboard feature that empowers teams to gain valuable insights from their project data.
Stick around as we delve into how to effectively use monday.com dashboards for analytics to drive informed and strategic decisions.
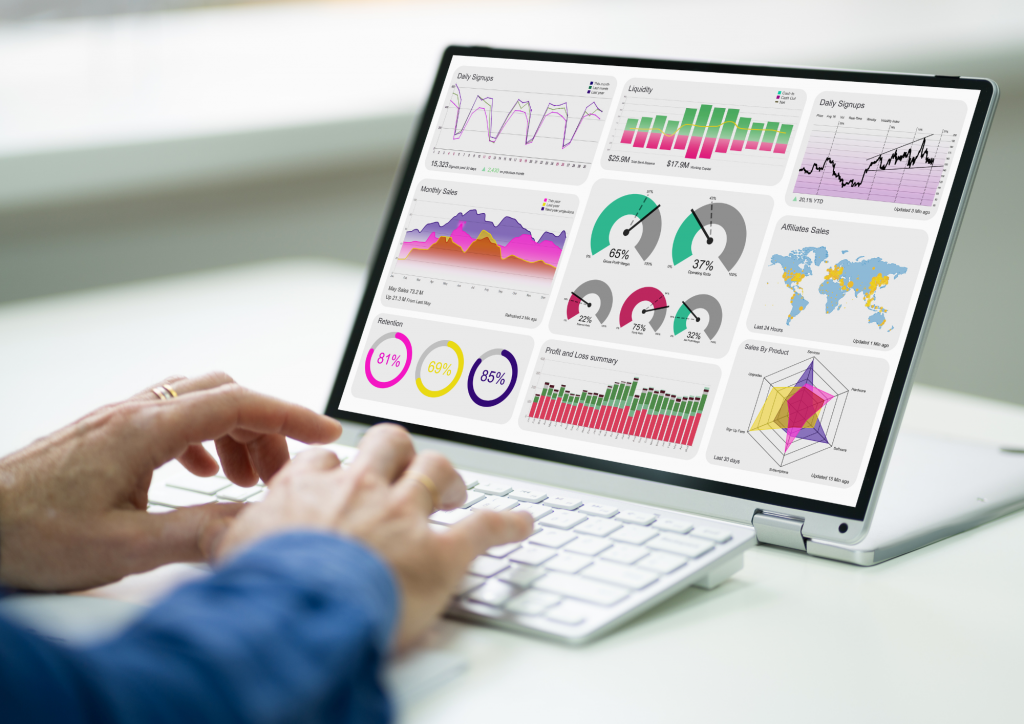
Everyone loves a good-looking dashboard—one that efficiently summarizes data and does not cause confusion. A dashboard gives you a high-level overview of your key performance indicators (KPIs) and other important data related to your project or workflow. It also allows your team to quickly understand the status and progress of different tasks. With more than 15 available widgets, monday.com serves as a great platform to help you craft the perfect dashboard.
Table of Contents:
Section 1: Understanding monday.com Dashboards
Section 2: Creating your monday.com Dashboard
Section 3: Useful Widgets for your Dashboard
Section 4: Utilizing Advanced Features
Section 5: Best Practices for Effective Dashboard Analytics
Conclusion: Empowering Data- Driven Decision Making
Monday.com provides a variety of widgets that can be utilized for analytics on their dashboards. These widgets offer visual representations of data, making it easier to interpret and analyze project progress and performance. Here are some of the key dashboard widgets that Monday.com offers for analytics:
Chart Widget: This widget allows you to create various types of charts (such as pie charts, bar charts, and line charts) based on your project data. It’s excellent for visualizing trends and comparing different data sets.
Timeline Widget: The Timeline widget provides a visual representation of tasks and their respective due dates. This is especially useful for tracking project timelines and dependencies.
Overview Widget: The Overview widget provides a summary view of key metrics and data points, giving you a high-level snapshot of project performance and progress.
Workload Widget: This widget allows you to see the workload distribution among team members. It’s valuable for resource allocation and workload management.
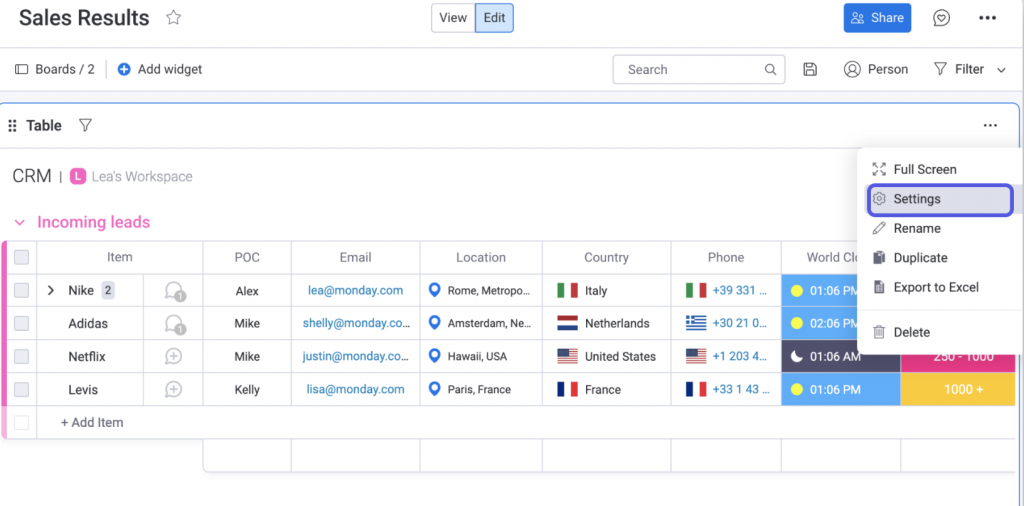
Table Widget: The Table widget displays data in a tabular format, making it easy to view and analyze information in a structured manner.
Monday.com dashboards for analytics offer a powerful tool for gaining valuable insights into your projects and workflows. By following this guide, you can create and utilize dashboards that drive informed, strategic decisions, leading to greater project success and efficiency.
Remember, the true value of a dashboard lies in its ability to provide actionable insights. Continuously refine and adapt your dashboard to meet the evolving needs of your projects and organization.
And level up your team’s productivity. With monday.com, you can empower your teams to gain valuable insights from their project data.
| Cookie | Duration | Description |
|---|---|---|
| cookielawinfo-checkbox-analytics | 11 months | This cookie is set by GDPR Cookie Consent plugin. The cookie is used to store the user consent for the cookies in the category "Analytics". |
| cookielawinfo-checkbox-functional | 11 months | The cookie is set by GDPR cookie consent to record the user consent for the cookies in the category "Functional". |
| cookielawinfo-checkbox-necessary | 11 months | This cookie is set by GDPR Cookie Consent plugin. The cookies is used to store the user consent for the cookies in the category "Necessary". |
| cookielawinfo-checkbox-others | 11 months | This cookie is set by GDPR Cookie Consent plugin. The cookie is used to store the user consent for the cookies in the category "Other. |
| cookielawinfo-checkbox-performance | 11 months | This cookie is set by GDPR Cookie Consent plugin. The cookie is used to store the user consent for the cookies in the category "Performance". |
| viewed_cookie_policy | 11 months | The cookie is set by the GDPR Cookie Consent plugin and is used to store whether or not user has consented to the use of cookies. It does not store any personal data. |